NanoPhotometer N50 Touch
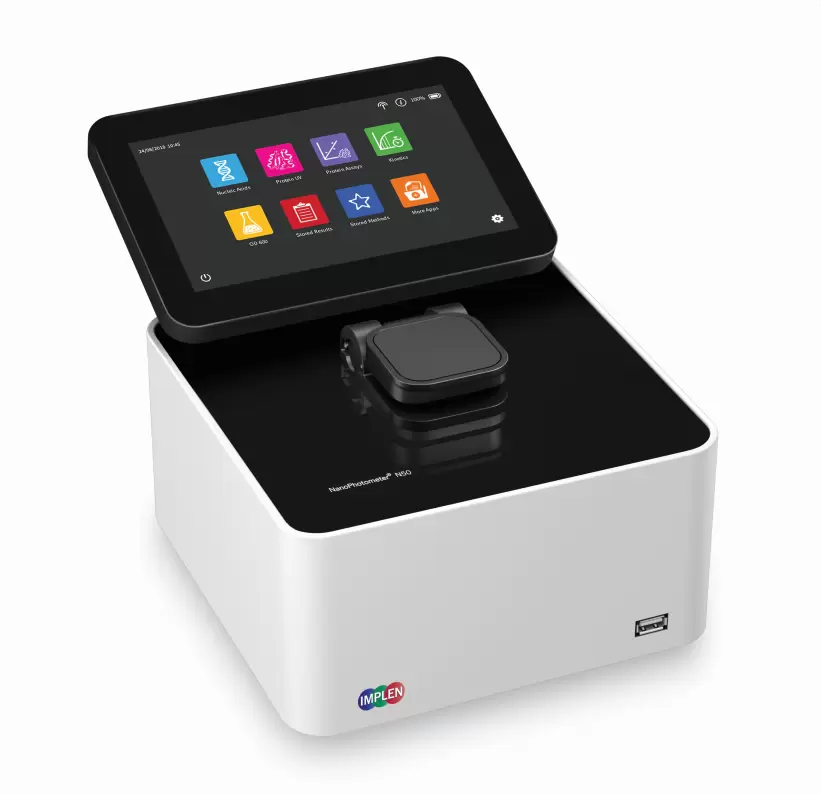
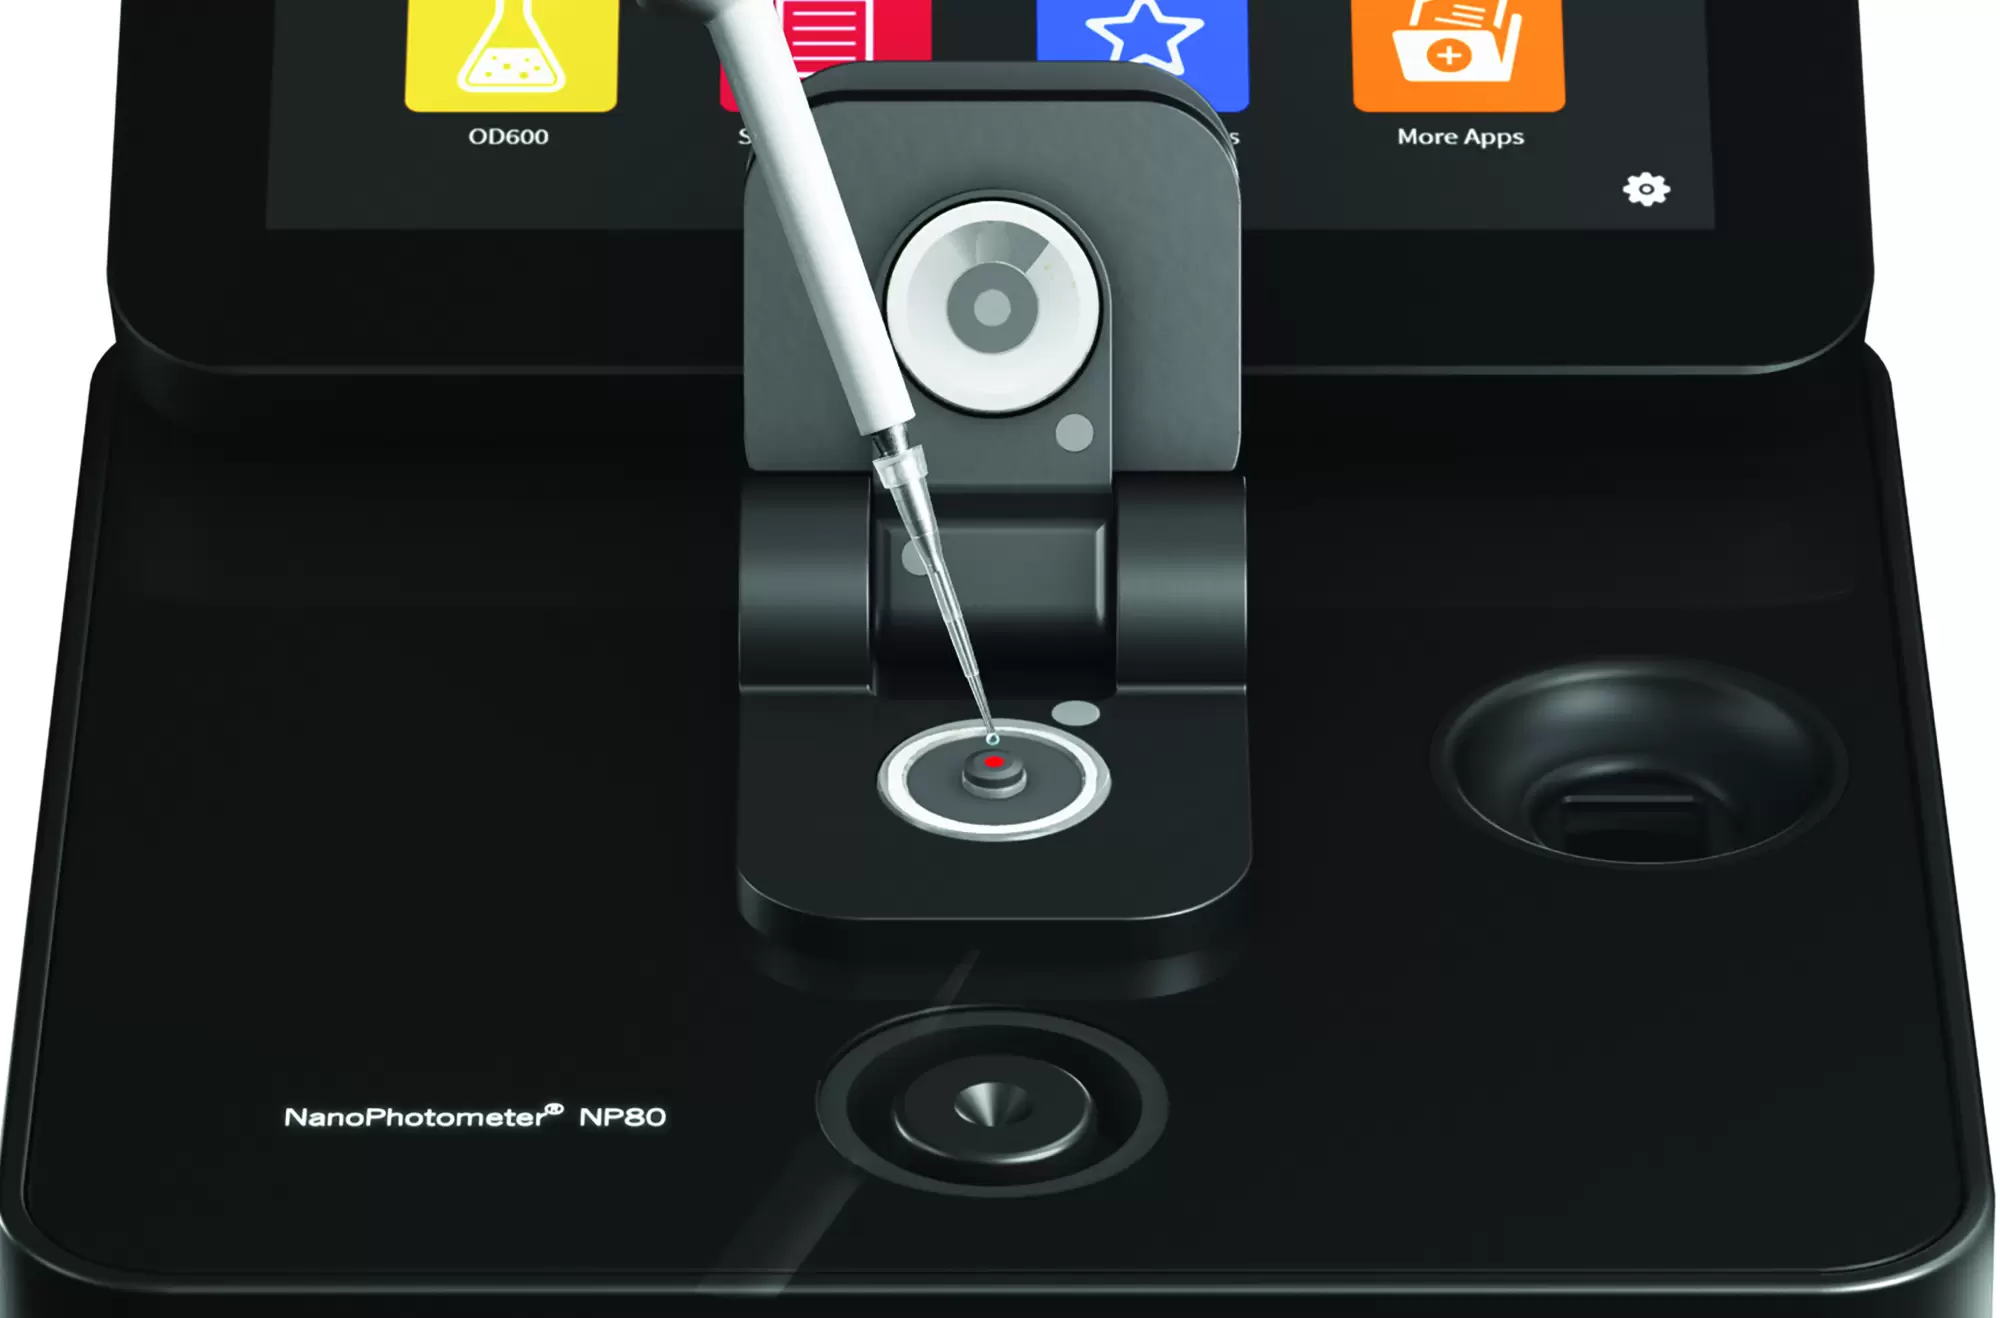
Microvolume spectroscopy with smallest sample volumes of as little as 0.3 µl. Enjoy the convenience of a lightweight portable instrument with a built-in 7 inch LCD glove compatible touchscreen and flexible unit control options. Illuminated quartz sample surface allows for easy sample application.

Product Description
Turn your NanoPhotometer N50 on and instantly measure without any lamp warm up time. Full scan capability range from 200 - 650 nm for rapid and complete sample analysis in as little as 6.0 seconds.
The patended True Path TechnologyTM covers the complete extensive dynamic range with two precisely defined path lengths. The sealed mechanical setup has two fixed anchor points, which are not changing over the lifetime of the instrument. No calibration or maintenance is necessary. Lifetime accuracy is guranteed.
Accurate Measurements
The patented Sample Compression TechnologyTM provides unmatched precision and accuracy with reliable measurement geometry of challenging samples including proteins. A capillary film is formed between two quartz surfaces with each sample eliminating the need for surface tension. Sample Compression TechnologyTM has the added benefit of holding the sample in place and free from evaporation in a sealed and protected micro-environment allowing for reliable protein measurements and for the analysis of samples in volatile solvents.

Confidence with Blank Control™
Be sure that your data are precise with Implen’s unique Blank Control™ feature. Blanks with high background or residues from previous users are the main cause for inaccurate readings. Blank Control™ will protect you from wasting time and precious sample on inaccurate readings caused by high background blanks or inappropriate cleaning.
Stand-Alone Operation
No computer required. Built-in Computer with directly attached 7 inch LCD glove compatible touchscreen and high performance Intel Celeron dual core 2.4 GHz processor. 64 GB of onboard memory provide powerful and easy storage of methods and data.
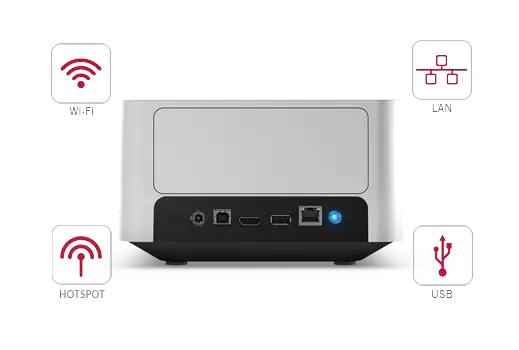
Equipped with Wi-Fi, USB A/B, HDMI and LAN interface connections for flexible instrument control and data saving options. Mobile and easy control of the NanoPhotometer® is possible via Wi-Fi from tablets or smartphones (Android OS & iOS). Front USB flash drive port for quick and easy data transfer.

Preprogrammed applications are available for nucleic acid and protein quantitation and purity checks as well as measurements of small molecules in organic solvents, kinetics in a drop, and more.
Mobile Design
Microvolume spectroscopy can now be taken anywhere with the small size of 20x20x12 cm and from 3.8 – 5.2 kg depending on configuration.
Certainty in Real Time
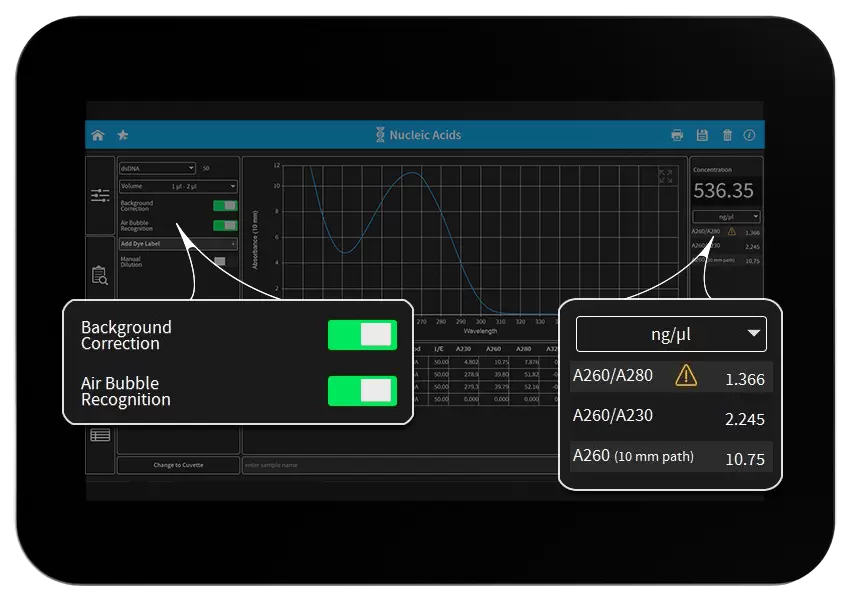
Sample Control™ - the leading edge quality control technology to identify air bubbles, sample impurities, turbidity, lint residue and potential contaminations. Sample Control™ monitors handling characteristics and sample quality in real time to ensure that the measured concentrations are reproducible and most precise.

Universal Data Output
Every NanoPhotometer® is able to generate formatted Excel and PDF document files for data processing or archiving of measurements on the lab network. The capability to print full page reports, labels and cryo labels via USB and through a network connection lends users the upmost flexibility for data output. Supported printers include AirPrint/IPP compatible printers supporting PDF format, printers with HP universal printer driver capability and DYMO label printers.
Limitless Spectroscopy Applications
Nucleic Acids - The Nucleic Acids Method provides one-step easy analysis allowing quantitation and purity check of dsDNA, ssDNA, RNA, mRNA, miRNA as well as Oligonucleotides. In this method, it is also possible to determine the dye concentration and frequency of dye incorporation for dye conjugated nucleic acids. For each measurement, the concentration calculated as well as the 260:230 and 260:280 purity ratios. In addition to a full scan graph, a full table with raw data points is provided.
Proteins - The Protein UV Method allows for protein quantitation and purity check (BSA, Antibodies, IgG, IgE, Serum Albumin, etc.) using direct A280 measurements. In this method is also possible to select from pre-programmed dye labels as well as to create custom dye methods to determine the degree of labeling of dye conjugated proteins. For each measurement results can be provided as an OD1 value or the concentration can be calculated based on the extinction coefficient for the selected protein at 280 nm. In addition to a full scan graph, a full table with raw data points is also provided.
Protein Assays - In the protein assays method it is possible to quantify proteins using colorimetric assays including the BCA, Bradford, Lowry, and Biuret assays.
Kinetics - The Kinetics Methods allows for the measurement of change in absorbance as a function of time at a fixed wavelength in a drop or in a cuvette. Kinetic studies are routinely used for a variety of applications including the enzymatic determination of compounds in food, beverage, and clinical laboratories. Absorbance (An) for each measurement point, delta A (difference between start and last absorbance), slope, and correlation coefficient (calculated from linear regression of the data points) are displayed.
OD600 Cell Density - The OD600 Method is used to determine the absorbance at 600 nm. Bacterial cell cultures are routinely grown until the absorbance at 600 nm (known as OD600; default setting) reaches approximately 0.4 prior to induction or harvesting. A linear relationship exists between cell number (density) and OD 600 up to approx. 0.6.
Wavelength - The Wavelength Method allows for measurement of simple absorbance (Abs) or transmission (%T) at a single user defined wavelength. The results window shows the amount of light passed through the sample relative to the reference.
Wavescan - The Wavescan Method records the absorption (Abs) or transmission (%T) spectrum for the range between two user defined wavelengths. The spectral plot allows simple identification of peak height and position. The curve interpretation of the entire spectrum provides most detailed information for a sample.1
Absorbance Ratio - The absorbance Ratio Method can be used to measure the ratio between two user defined wavelengths.
Concentration - The Concentration Method determines the concentration of samples from a single wavelength absorbance reading. The amount of light that has passed through a sample relative to a reference is multiplied by a factor to obtain the concentration. The factor may be a known figure, or may be calculated by the instrument by measuring a standard of known concentration.
Standard Curve - The Standard Curve Method can be utilized to generate a standard curve at a single user specified wavelength. The preparation of a multi-point calibration curve from standards of known concentration to quantify unknown samples is a fundamental use of a spectrophotometer; the NanoPhotomer® has the advantage of being able to store this curve as a method to be recalled for future experiments.
Custom Apps - Fully customizable application development is possible with the proprietary NanoPhotometer® Operating System. Please contact Implen team for more information about custom app design to meet your individual application needs.
References
- Nicole M. Wanner, Mathia Colwell, Chelsea Drown & Christopher Faulk (2021) Developmental cannabidiol exposure increases anxiety and modifies genome-wide brain DNA methylation in adult female mice Clinical Epigenetics
- Ebrima Joof, Peter S. Andrus, Kehinde Sowunmi, Victor M. Onyango, Christopher M. Wade (2020) Comparing PCR techniques against conventional cercarial shedding methods for detecting Schistosoma mansoni infection in Biomphalaria snails Acta Tropica
- Qiang Zheng , Mengjiao Wang , Lin Zhang , Waqas Ahmad , Hongxia Li , Yigang Tong ,Guojun Zheng , Shaozhou Zhu (2020) Topology engineering via protein catenane construction to strengthen an industrial biocatalyst Jorunal of Biotechnology
- Jaime A. Teixeira da Silva, Norbert Hidvégi, Andrea Gulyás & Judit Dobránszki (2019) mRNA transcription profile of potato (Solanum tuberosum L.) in response to explant cutting Plant Cell, Tissue and Organ Culture
- Dandan Wang, Yajuan Luo, Guangwei Wang, Qing Yang (2015) Circular RNA expression profiles and bioinformatics analysis in ovarian endometriosis Molecular Genetics & Genomic Medicine
- Catalog Number
N50-Touch-IMP - Supplier
Implen - Size
- Shipping
RT

