H3K4me1 Antibody, SNAP-Certified™ for CUT&RUN and CUT&Tag
Product Description
This H3K4me1 (histone H3 lysine 4 monomethyl) antibody meets EpiCypher’s lot-specific SNAP-Certified™ criteria for specificity and efficient target enrichment in both CUT&RUN and CUT&Tag applications. This requires <20% cross-reactivity to related histone PTMs determined using the SNAP-CUTANA™ K-AcylStat Panel of spike-in controls. High target efficiency is confirmed by consistent genomic enrichment at varying cell inputs: 500k and 50k cells in CUT&RUN; 100k and 10k cells in CUT&Tag. High efficiency antibodies display similar peak structures at representative loci and highly conserved genome-wide signa even at reduced cell numbers. H3K4me1 either flanks H3K4me3 at the transcription start site (TSS) or coincides with H3K4me3 [1].
Validation Data - CUT & Tag

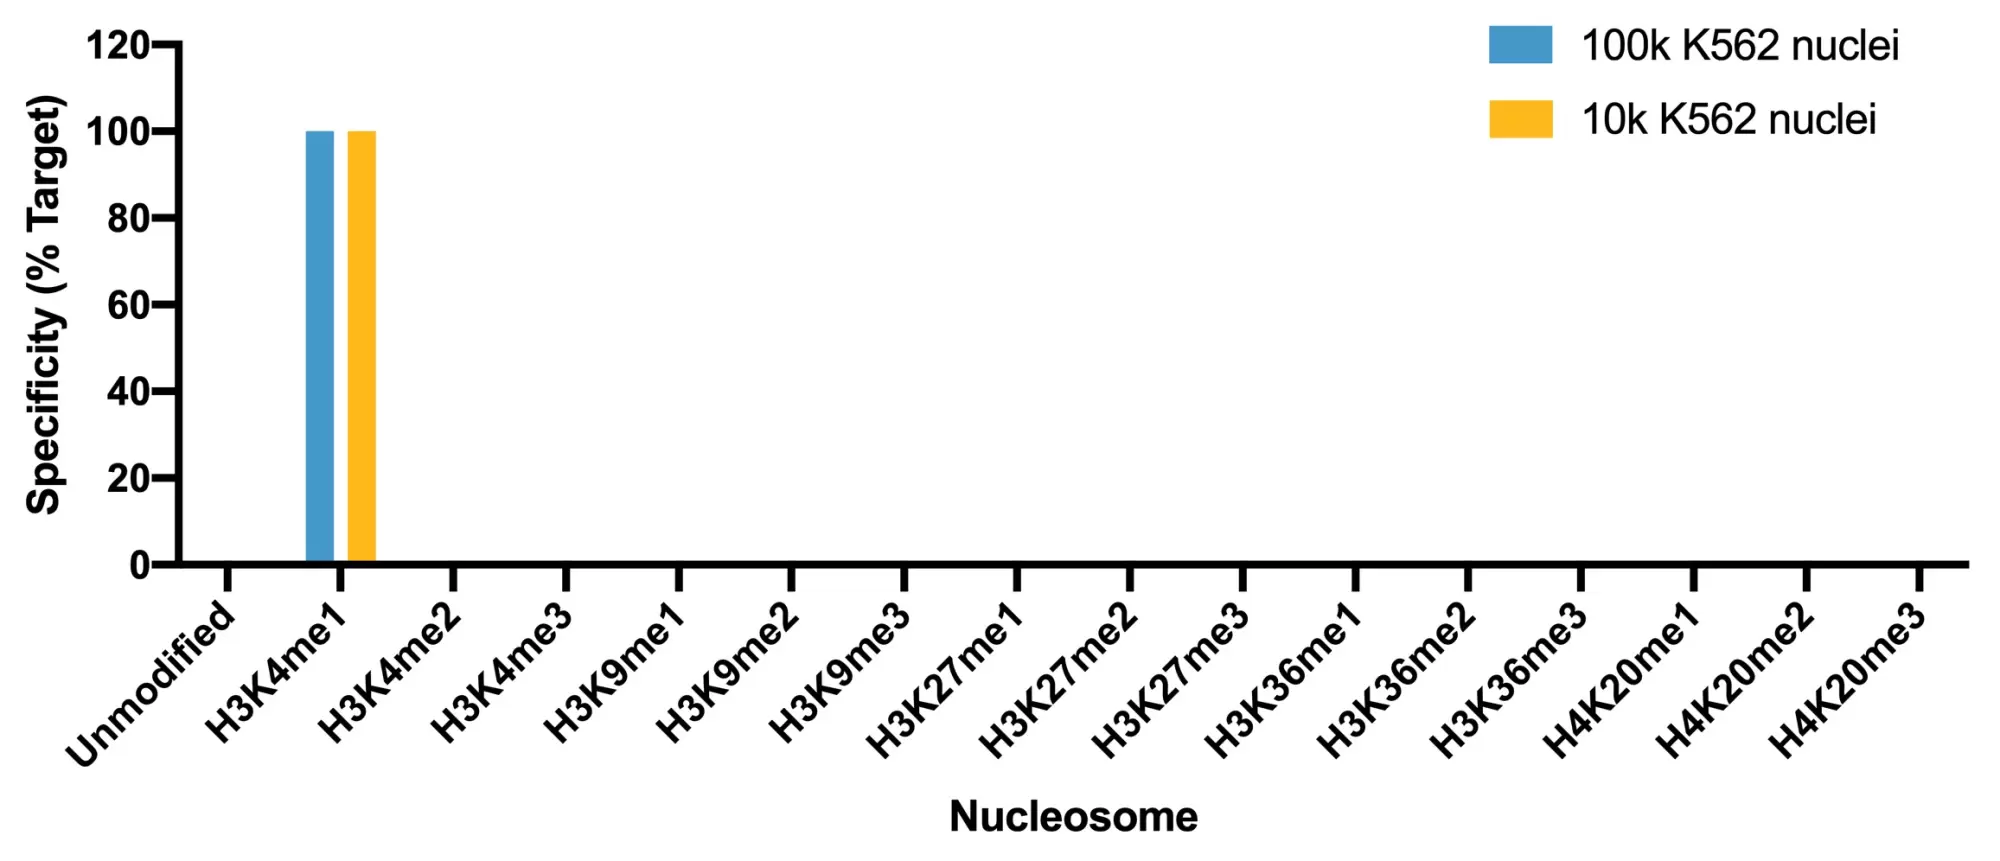
Figure 4: SNAP specificity analysis in CUT&Tag. CUT&Tag was performed and CUT&Tag sequencing reads were aligned to the unique DNA barcodes corresponding to each nucleosome in the K-MetStat panel (x-axis). Data are expressed as a percent relative to on-target recovery (H3K4me1 set to 100%).

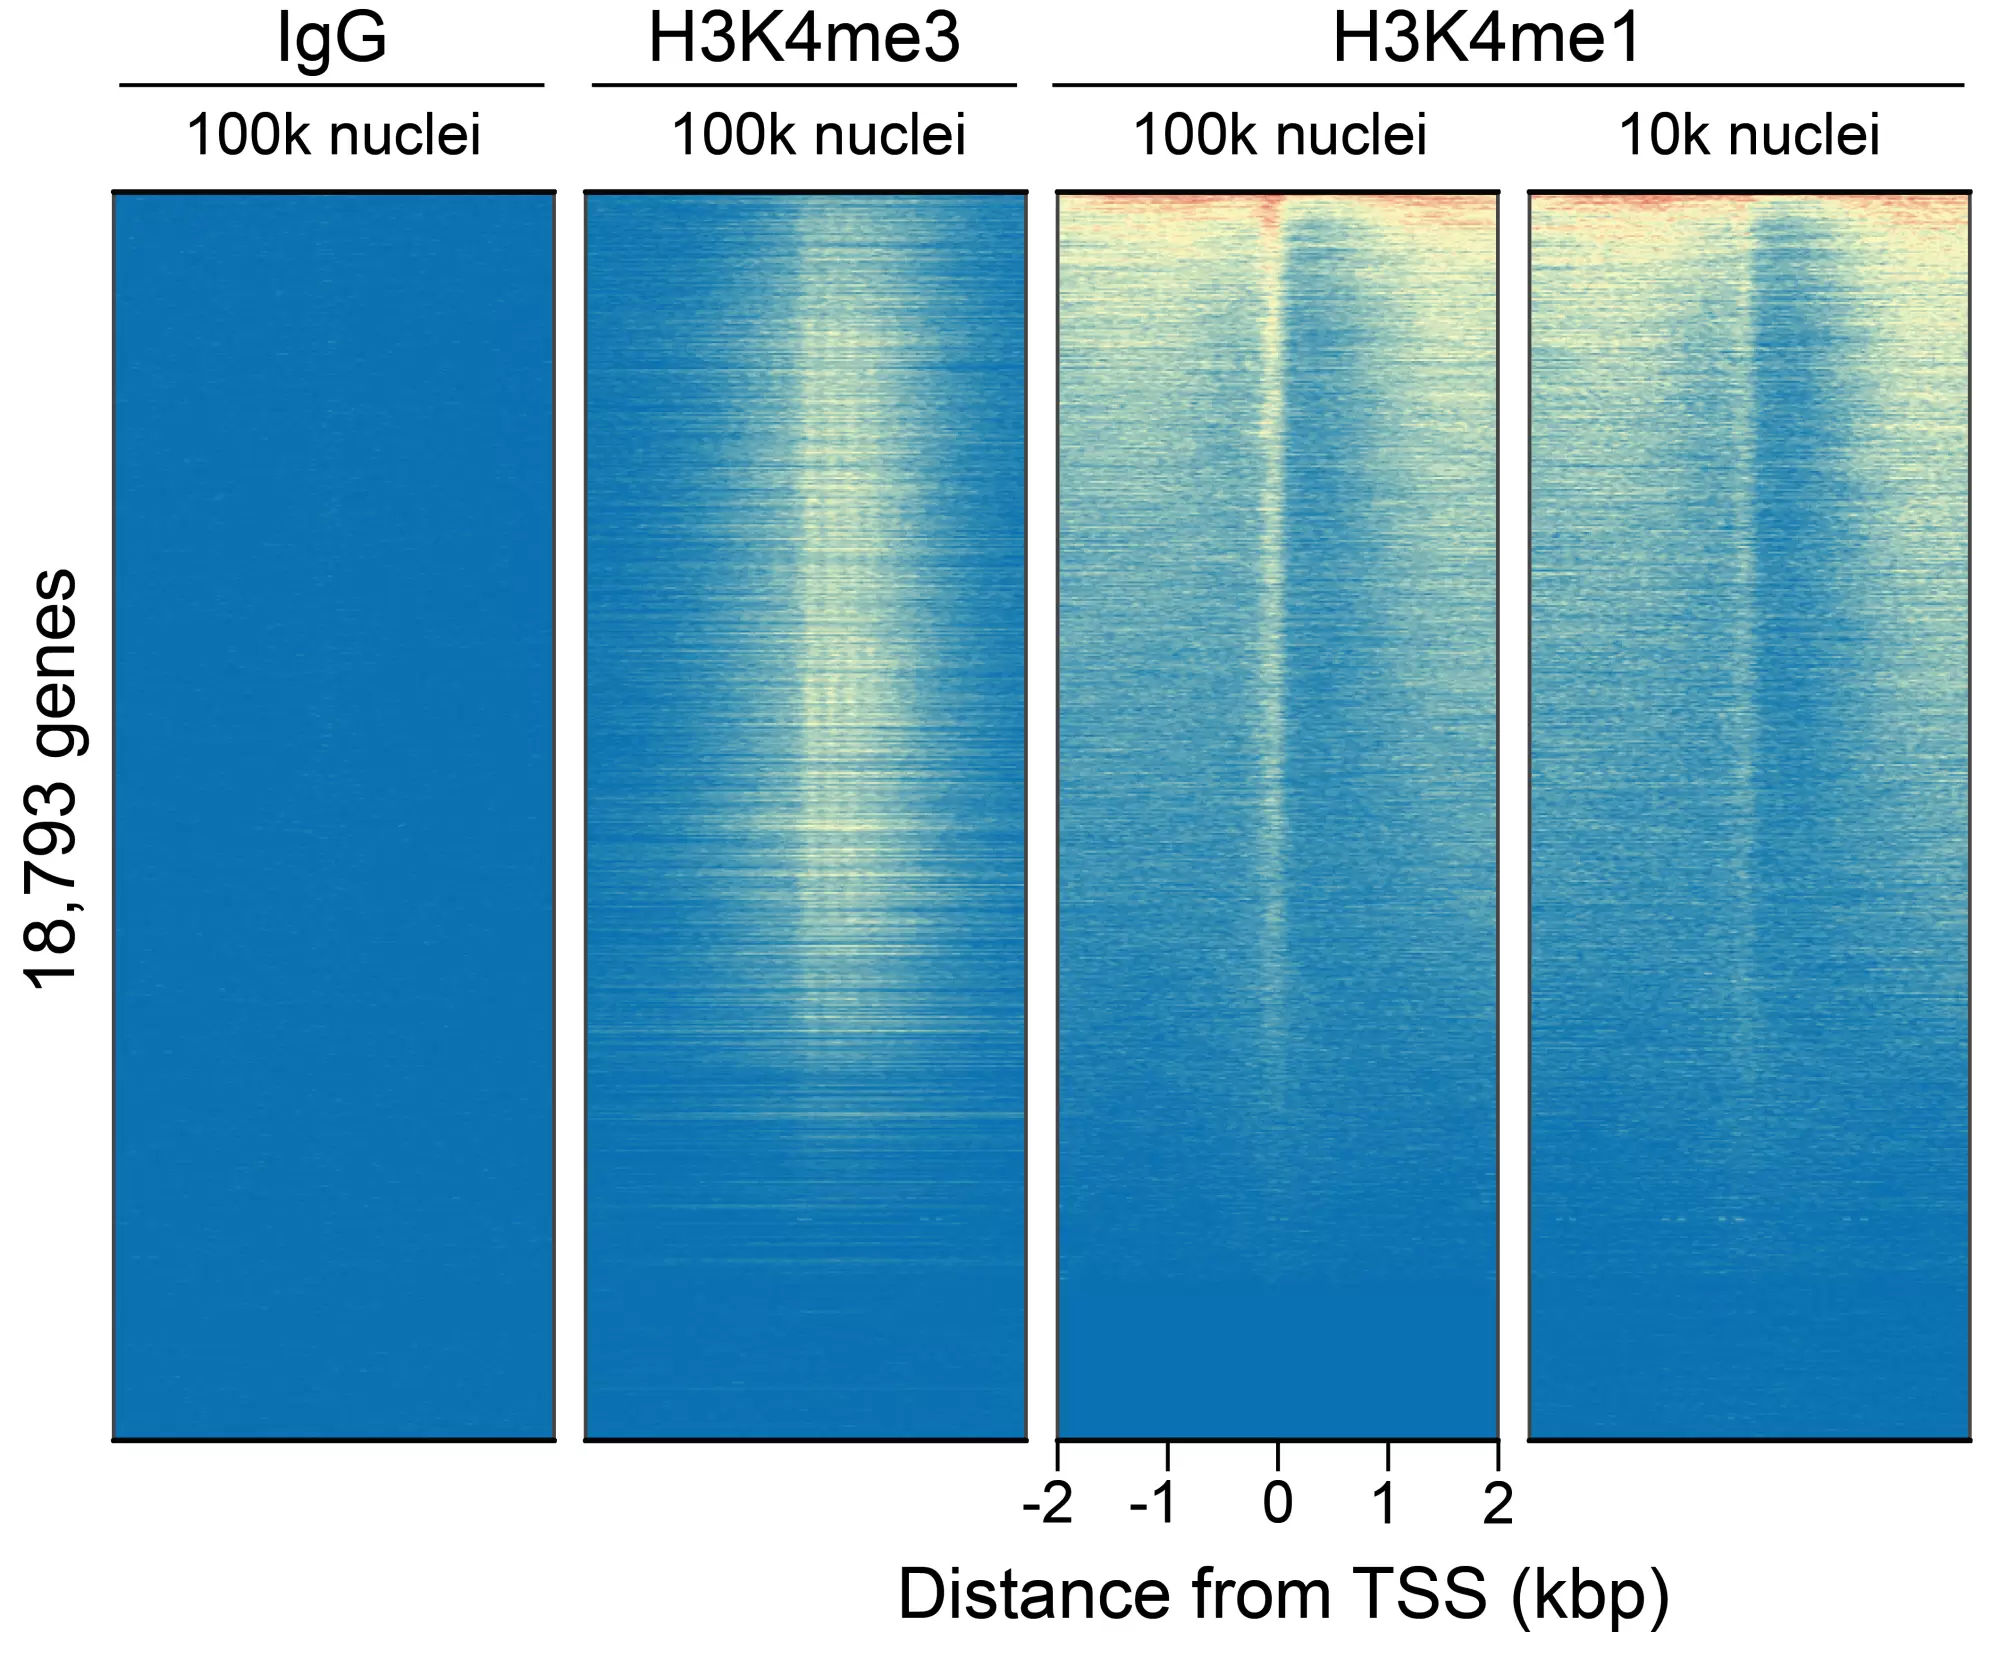
Figure 5: CUT&Tag genome-wide enrichment. CUT&Tag was performed and sequence reads were aligned to 18,793 annotated transcription start sites (TSSs ± 2 kbp). Signal enrichment was sorted from highest to lowest (top to bottom) relative to the H3K4me1 - 100k nuclei sample (all gene rows aligned). High, medium, and low intensity are shown in red, yellow, and blue, respectively. H3K4me3 positive control and H3K4me1 antibodies produced the expected enrichment pattern, which was consistent between 100k and 10k nuclei and greater than the IgG negative control.

Figure 6: H3K4me1 CUT&Tag representative browser tracks. CUT&Tag was performed and gene browser shots were generated using the Integrative Genomics Viewer (IGV, Broad Institute). H3K4me1 antibody tracks display the characteristic enrichment known to be consistent with the function of this PTM [1]. Similar results in peak structure and location were observed for both 100k and 10k nuclei inputs.
Validation Data - CUT & RUN

Figure 4: SNAP specificity analysis in CUT&RUN. CUT&RUN was performed and CUT&RUN sequencing reads were aligned to the unique DNA barcodes corresponding to each nucleosome in the K-MetStat panel (x-axis). Data are expressed as a percent relative to on-target recovery (H3K4me1 set to 100%).

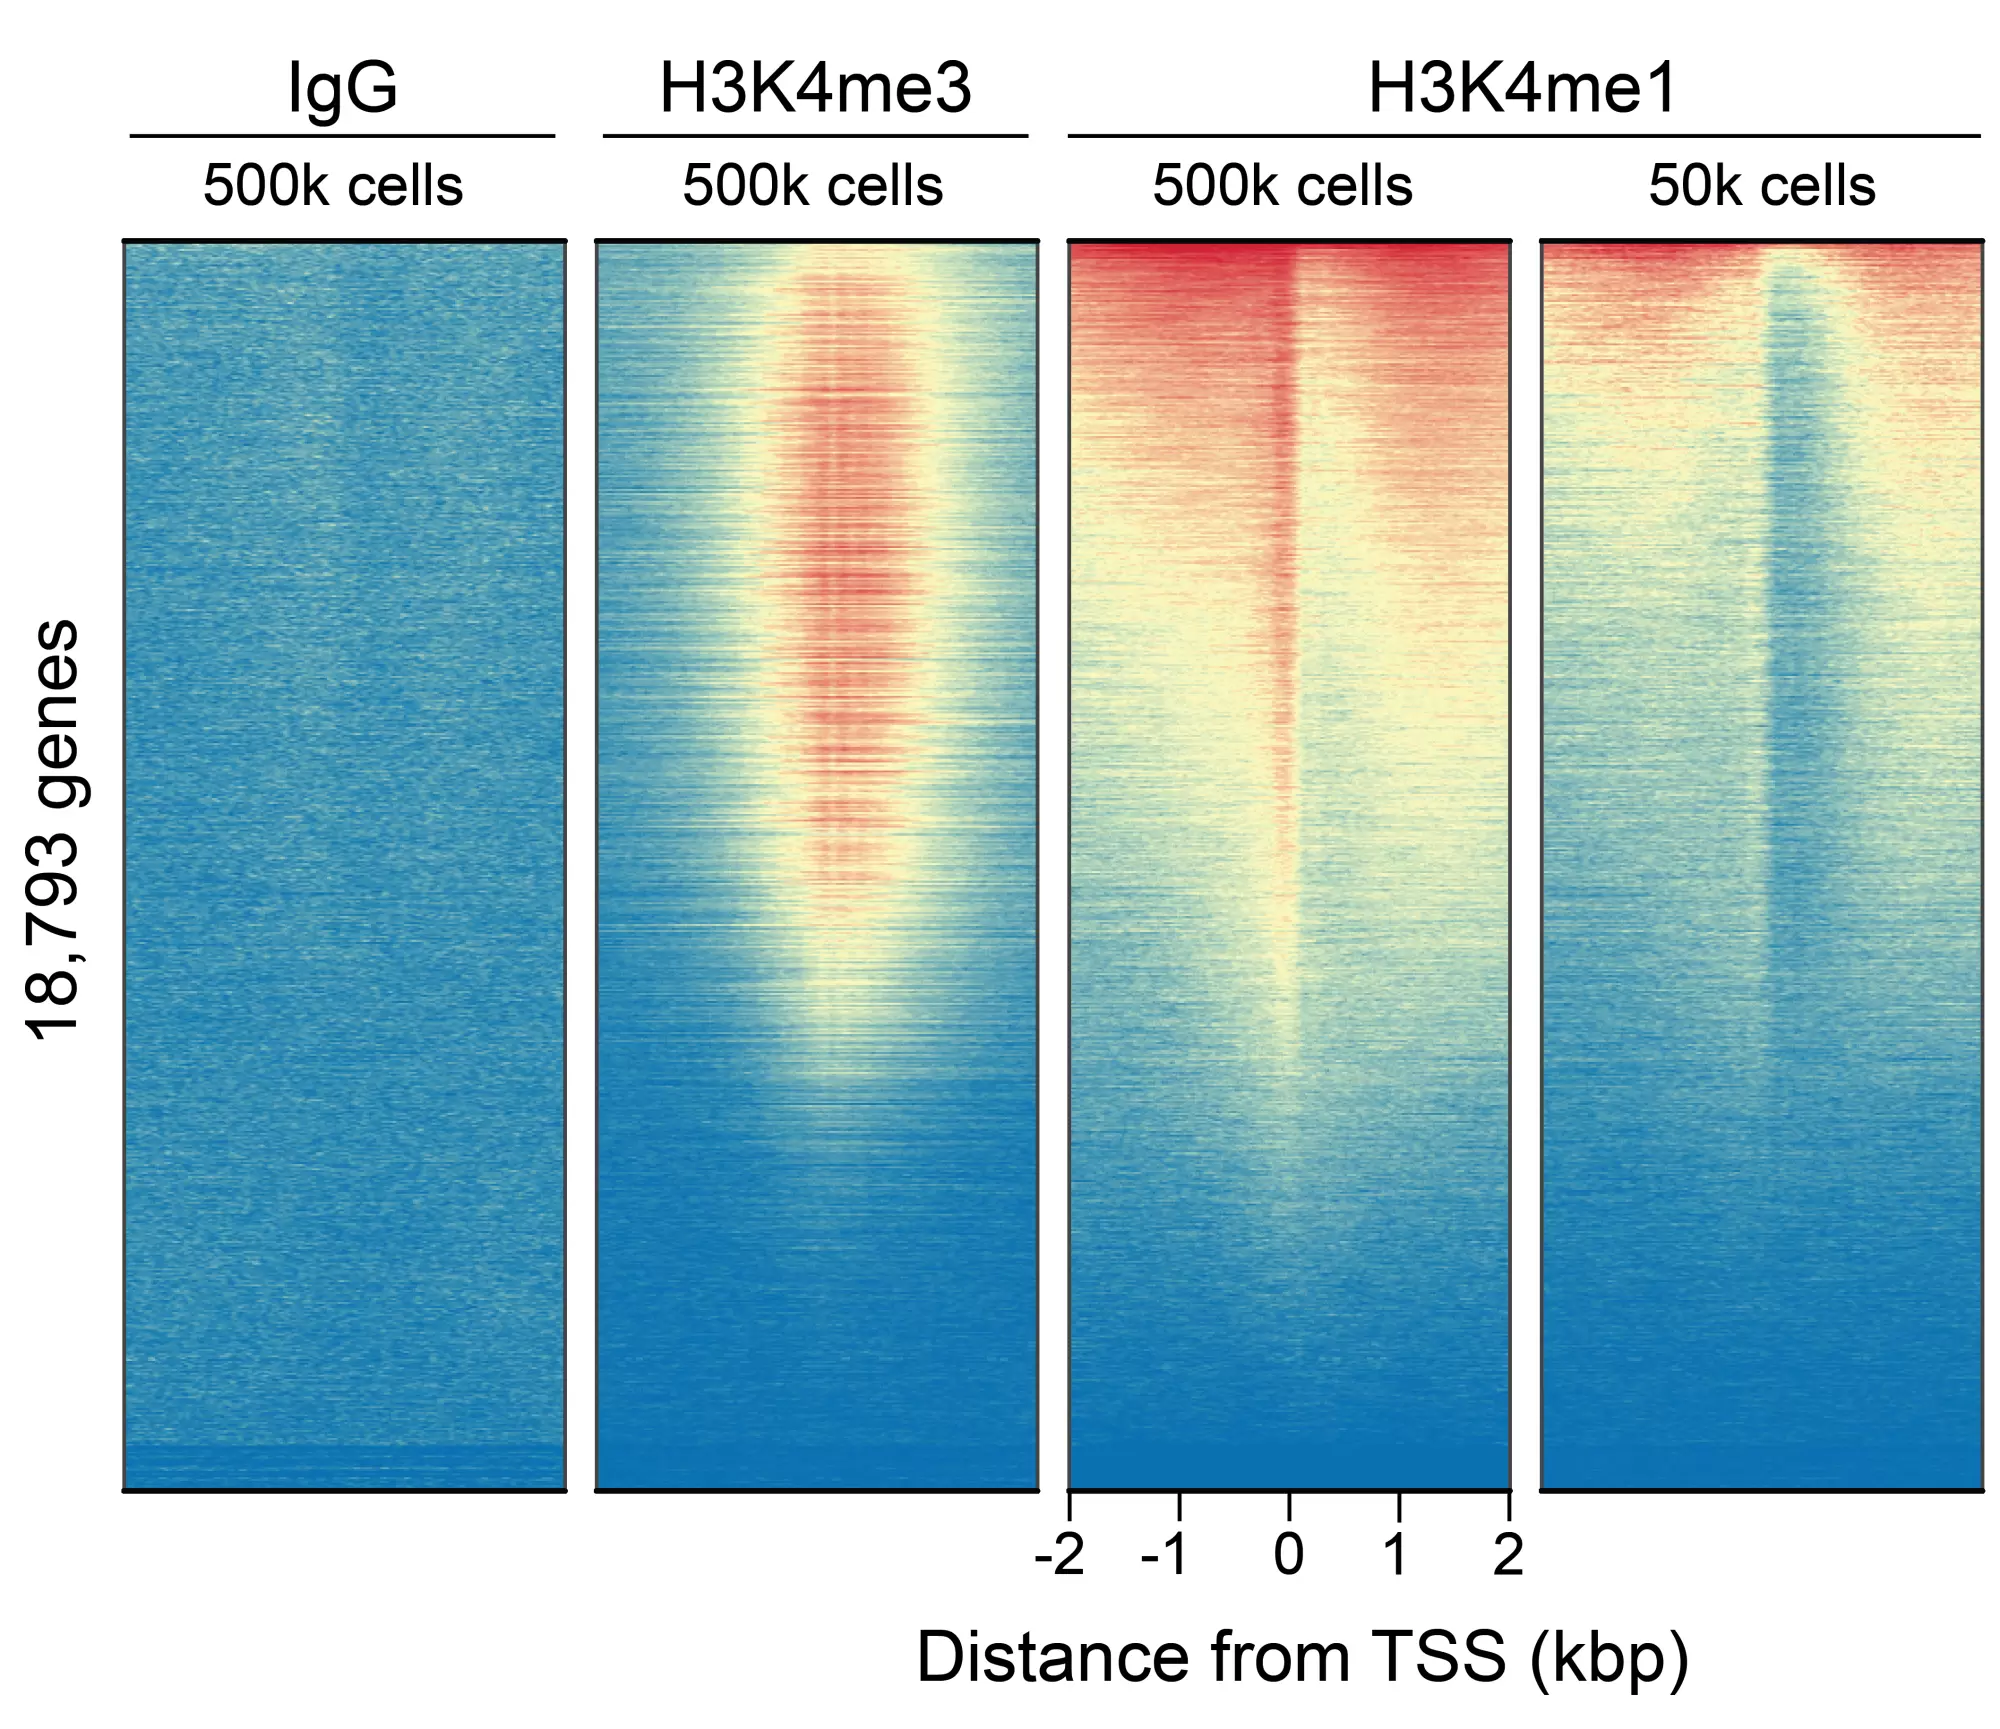
Figure 5: CUT&RUN genome-wide enrichment. CUT&RUN was performed and sequence reads were aligned to 18,793 annotated transcription start sites (TSSs ± 2 kbp). Signal enrichment was sorted from highest to lowest (top to bottom) relative to the H3K4me1 - 500k cells sample (all gene rows aligned). High, medium, and low intensity are shown in red, yellow, and blue, respectively. H3K4me3 positive control and H3K4me1 antibodies produced the expected enrichment pattern, which was consistent between 500k and 50k cells and greater than the IgG negative control.

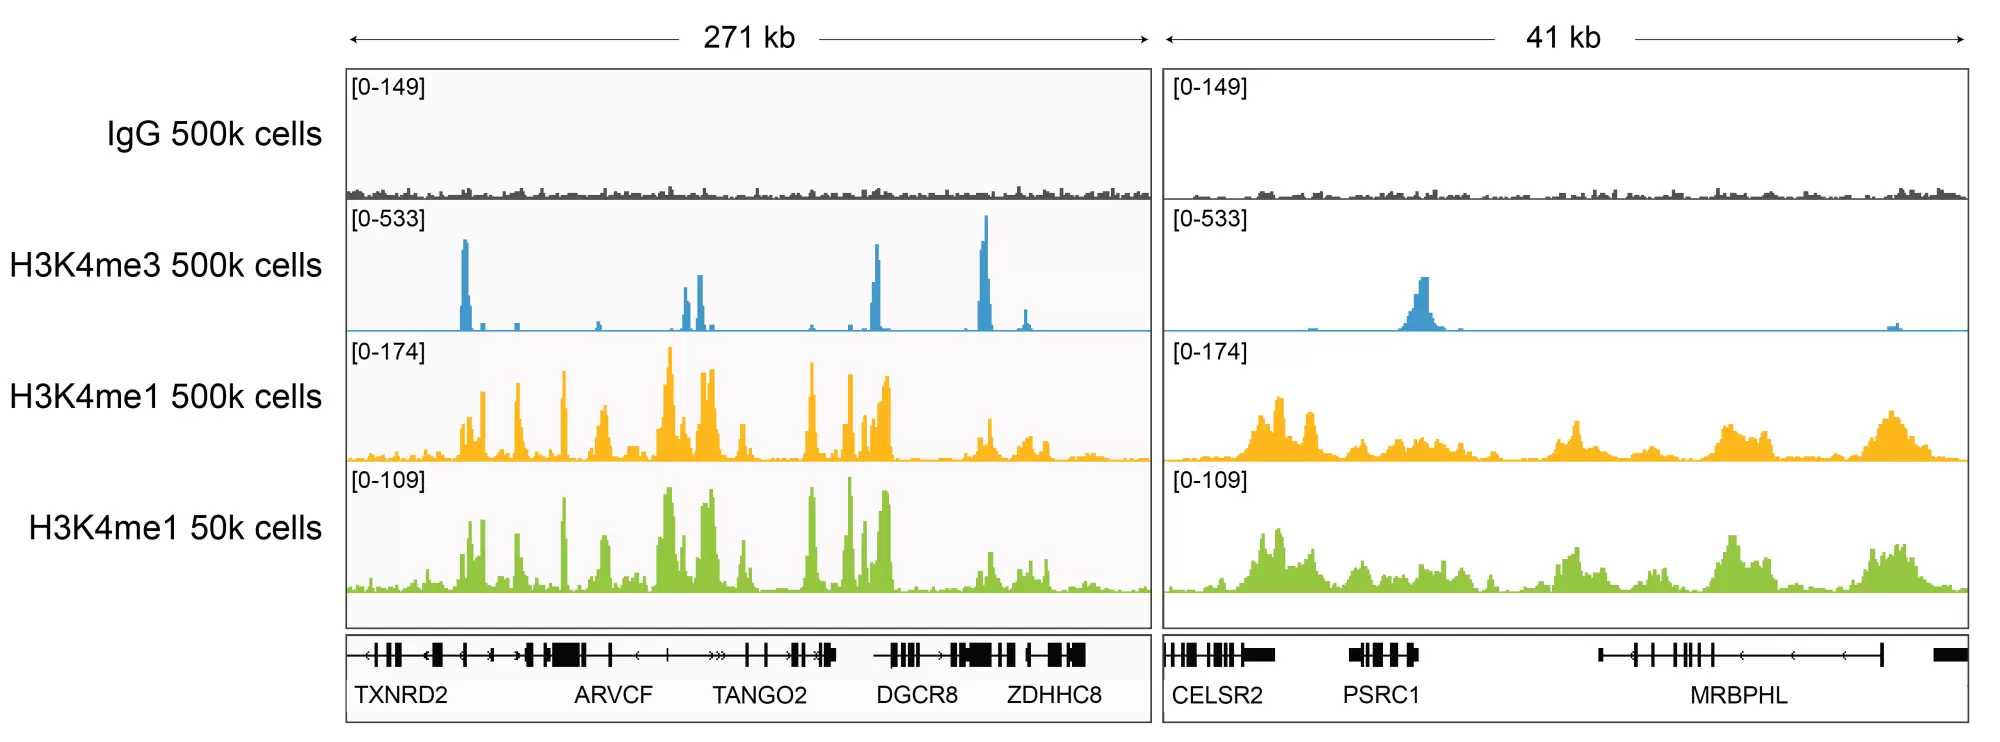
Figure 6: H3K4me1 CUT&RUN representative browser tracks
CUT&RUN was performed and gene browser shots were generated using the Integrative Genomics Viewer (IGV, Broad Institute). H3K4me1 antibody tracks display the characteristic enrichment known to be consistent with the function of this PTM [1]. Similar results in peak structure and location were observed for both 500k and 50k cell inputs.
Background References
[1] Bae & Lesch Front Cell Dev. Biol. (2020). PMID: 32432110
Product Citations
- Turano Paolo S., Akbulut Elizabeth, Dewald Hannah K., Vasilopoulos Themistoklis, Fitzgerald-Bocarsly Patricia, Herbig Utz, MartÃnez-Zamudio Ricardo Iván (2025) Epigenetic mechanisms regulating CD8+ T cell senescence in aging humans bioRxiv
- Blake A. Caldwell, Yajun Wu, Jing Wang, Liwu Li (2024) Altered DNA methylation underlies monocyte dysregulation and immune exhaustion memory in sepsis Cell reports
- Conelius Ngwa, Afzal Misrani, Kanaka Valli Manyam, Yan Xu, Shaohua Qi, Romana Sharmeen, Louise McCullough, Fudong Liu (2024) Escape of Kdm6a from X chromosome is detrimental to ischemic brains via IRF5 signaling Europe PMC
- Kamakoti P Bhat, Jinchu Vijay, Caroline K Vilas, Jyoti Asundi, Jun Zou, Ted Lau, Xiaoyu Cai, Musaddeque Ahmed, Michal Kabza, Julie Weng, Jean-Philippe Fortin, Aaron Lun, Steffen Durinck, Marc Hafner, Michael R Costa, Xin Ye (2024) CRISPR activation screens identify the SWI/SNF ATPases as suppressors of ferroptosis. Cell reports
- Maya M. Arce, Jennifer M. Umhoefer, Nadia Arang, Sivakanthan Kasinathan, Jacob W. Freimer, Zachary Steinhart, Haolin Shen, Minh T. N. Pham, Mineto Ota, Anika Wadhera, Rama Dajani, Dmytro Dorovskyi, Yan Yi Chen, Qi Liu, Yuan Zhou, Danielle L. Swaney, Kirsten Obernier, Brian R. Shy, Julia Carnevale, Ansuman T. Satpathy, Nevan J. Krogan, Jonathan K. Pritchard, Alexander Marson (2024) Central control of dynamic gene circuits governs T cell rest and activation Nature
- Catalog Number
13-0057-EPC - Supplier
EpiCypher - Size
- Shipping
Blue Ice

